Use Ctrl F to find the topic you need
Use Ctrl + to zoom into the images
Thursday 29th January 2015
Health Lesson 23
We are each working on presentations for Obesity, Malnutrition and Famine, that will occupy the following three lessons, and involve completing 2 essays.
Obesity is a medical condition in which excess body fat has accumulated to the extent that it may have an adverse effect on health. More than 40 million children under the age of five were overweight in 2011 and in the UK during 2011-12 there were 11,736 hospital admissions due to obesity – this over 11 times higher than during 2001-02.
Causes of Obesity include:
- Easy access to cheap, high-energy, highly-fattening food.
- Jobs are much less active than in the past and many leisure activities such as watching television, playing video games and browsing the internet are usually done sitting down.
- People drive or use public transport and walk a lot less than they used to.
- Extreme health risks, including increased risk of diabetes, CHD, high blood pressure, strokes, back and joint pain, breast cancer, bowel cancer, depression, asthma, difficulties sleeping/breathing while sleeping, gallstones, reduced fertility
- Difficulties moving around, leaving the home, reduced mobility etc. that directly impacts a person's ability to work and contribute to the economy
- The NHS spends £6bn on obesity-related health issues and £10bn on diabetes a year.
- Government-led action plans, such as the UK's Change 4 Life.
- Free exercise and weight loss support groups, supplied through the NHS or through other companies, as well as dieting agencies which assistance towards maintaining a healthy diet
- Targeting obesity in children by encouraging exercise and healthy eating in schools, to promote healthy living before obesity occurs, so that healthy lifestyles continue into adulthood
- Medication and surgery, although expensive, are used in emergency cases.
Causes of malnourishment include:
- Directly, a lack of or abundance of a certain nutrient in your diet, which can be caused by famine, any condition which involves a change of appetite such as cancer or liver disease, depression or anorexia, dementia, or dysphagia, which makes swallowing difficult.
- Medical conditions which involve persistent diarrhoea or vomiting.
- Living alone or being socially isolated, limited knowledge/education about nutrition and cooking, reduced mobility, alcohol or drug abuse, low income or poverty
- Health consequences, including fatigue, taking a long time to recover from infection, delayed healing of a wound, irritability, poor concentration, weak control over body temperature, depression, poor vision, pain in bones and joints and death
- In children, malnutrition creates 'stunted' growth (1/4 of the worlds children are stunted), changes in behaviour (irritability, sluggishness, anxiety) or changes in hair and skin colour.
- Deaths by malnutrition reduce the workforce of a country, and malnourished people are often unable to work, which creates a cycle of poverty if they are malnourished because of poverty
- The work of NGOs, the UN and government aid in countries that have suffered famines to give emergency food and relief aid to the undernourished people there.
- Hospital treatment of the malnourished, perhaps involving a nasogastric tube or PEG tube
- Improved Education, to increase the incomes of people living in poverty to keep them from becoming undernourished and to improve their knowledge about nutrients and cooking
- If women farmers had the same access to resources as men, the number of hungry in the world could be reduced by up to 150 million.

Causes of Famine:
- The three most dominant causes of famine are weather fluctuations and increased temperatures which result in drought, increased food costs due to economic instability, and violent political instability, all of which are worsened by the factor of poverty.
- Drought results in crop failure, which leads to an inflation of food prices. Combined with poverty, this leaves people vulnerable to starvation.
- Conflict affects the way people deal with food scarcity. It stops the cultivation of land, destroys market centres and transport links, creates economic decline, and creates refugees.
- Production failure, access failure and response failure cause and affect the severity of a famine
Consequences of Famine:- Severe loss of life. The famine that affected Somalia from 2010 to 2012 killed 260,000 people, half of which were children. The famine was a result of internal conflict and crop failure.
- Culturally, famine results in the loss of important members of society, such as teachers, doctors, leaders, mothers and children. It can also result in the selling of family assets out of desperation, eating foods they would usually not eat, or emigration to other areas.
- Stealing, especially from the sick or old, prostitution and the creation of refugees.
- Relief aid by the UN, governments or NGOs such as Oxfam reduces mortality.
- Accelerated investment in food production, especially in areas which face chronic food shortages, and improved support for farmers and pastoralists, ie better crops, cheaper inputs
- Alleviation of rural poverty generally, inc. investment in infrastructure, education and markets
- Social protection and assistance to poor households through access to food, insurance, prepared support for times of crisis, as well as intervention to stop violent political conflict

Tuesday 27th January 2015
Health Lesson 23
Generally, in the UK, there is a North-South divide when it comes to health. Life expectancy is lower in Scotland, and continues to become lower as you travel north. There are, however, some exceptions, for example some towns in Central London and Wales experience low LE as well.


Premature deaths are the number of deaths before the age of 75 (in the UK). Overall, premature deaths are far higher in the North, especially in Scotland, than in the rest of the UK, although there is a belt of high premature deaths across Liverpool, Manchester and Leeds over to Hull. Within Central London, Southwark, Lewisham and Greenwich experience higher rates of premature deaths than areas like Kingston, Richmond and Sutton, most likely because they are more affluent areas.
Health varies regionally across the UK, and this affects the cost of the NHS in a certain area.

- Environment (air quality, settlement size, pollution)
- Age & Gender (Retirement areas, work and violence)
- Economic (occupation, education, income, GDP, class divide, profession)
- Behaviours (reluctance, exercise, diet, alcoholism, smoking, culture)
Socioeconomic status: In all regions of England babies born to fathers in a lower social class (unskilled and unemplyed) have higher infant mortality rate than those born to fathers in a higher social class (professional and managerial). This could be due to the income divide, but is also a result of cultural differences across the classes, and perhaps the levels of depression (higher in the lower classes). This could also be explained by material deprivation, which would be a contributing factor, and the gap in the quality of housing and different levels of employment. Men aged 20-64 within lower classes have higher mortality rates than those in a higher class of society.
Environment: the relationship between the weather and various aspects of health has been studied in great detail. Relationships have been found between temperature, heart disease and pneumonia, and between rainfall and heart disease. Furthermore, pollution in the air has led to the develop of asthma in young children, particularly in cities. Additionally, in places such as Cornwall there is a larger risk of developing cancer due to the increased radiation from rocks below the ground, as there are high amounts of radon underground in the southwest. This is thought to be the cause for the high levels of lung cancer in the area.
The poorest people in Britain are 2x as likely to die before they are 65 than the richest. Today's life expectancy gap across the class divide is the highest it has been since the depression.
Regional variations in health can also be affected by proximity to universities, which can often change data on alcohol or unhealthy food consumption for an area. NHS funding to certain areas also affects the types of diseases seen there and the impact that they have.
For further information, see the video above or the link below.
http://www.bbc.co.uk/news/health-22844227
Thursday 22nd January 2015
Health Lesson 22
Diseases of Affluence are diseases we in MEDCs should all be worrying about; They are diseases thought to be the result of increasing wealth. They are non-communicable, and cannot be transferred from one person to another, and are instead a result of our own lifestyle choices. Examples include Coronary Heart Disease (CHD), Obesity, some forms of cancer and diabetes.
Causes may include:
- Unhealthy diet
- Tobacco use
- Physical inactivity
- Harmful use of alcohol

Treatment options for CHD involve:
-Stents
-Bypass Grafts
-Statins
-ACE inhibitors
-Beta blockers
-Aspirin
More than 60% of the global burden of CHD occurs in NICs. In India, people are genetically more likely to suffer from CHD, and this is not helped by their sedentary lifestyles, and the increased rate of smoking.
Scotland
CHD is more common in Scotland than the rest of the UK, especially less wealthy areas. Men in the 10% most deprived areas of Scotland lives 13.2 years less than those in the 10% least deprived. In Scotland as a whole, premature mortality is 25% higher than the rest of England, and mortality for CHD is 86% higher in deprived areas.
Factors which increase the risk of CHD include:
- Smoking
- High blood pressure
- High cholesterol
- Diabetes
- Family history
- Peripheral artery disease
- Obesity
- Lack of exercise
- High-fat diet
- More likely if you are male
- More likely if you are aged 75 and over
- More likely if you are Indian or Pakistani
- Less likely if you are Black Caribbean or Chinese
More information can be found on the WHO website or on the NHS website.
Thursday 15th January 2015
Health Lesson 21
Today we have studied two main diseases of poverty, and major killers within LEDCs, tuberculosis (or TB) and HIV/AIDS. HIV stands for Human Immunodeficiency Virus.
HIV and AIDS can only be transferred through the sharing of bodily fluids, such as blood, sexual fluids and breast milk. It is not an airborne or waterborne disease. It is only under risk of spreading when unsafe sex has occurred, when needles are shared or when passed from parent to child via breast milk.
HIV and AIDS are mostly found in LEDCs, especially Southern Africa.
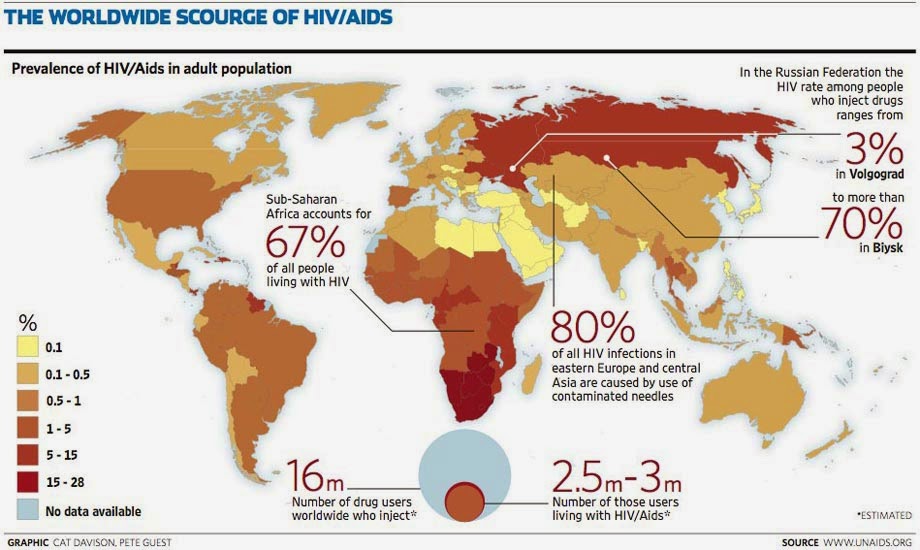
However, they are also quite common in Russia, due to the amount of drug abuse that happens there illegally, and the fact that persecution makes a lot of drug addicts more desperate, and more likely to share needles than find their own.
Here are some facts about HIV/AIDS:

Tuesday 13th January 2015
Tuberculosis is a disease of poverty. It can be easily treated or prevented, but only with the resources or funds to do so, which is why it is more common in LEDCs. Tuberculosis (TB) is a bacterial infection that attacks the lungs. It is an airborne disease, spread when the infected coughs or sneezes.
It is estimated that around 1/3 of the world's population is infected with TB. 10% of these people are likely to get full TB and die.
Where can TB be found?
- India
- Indonesia
- South Africa
- Bangladesh
- Mali
- Madagascar
- Ivory Coast
- Sudan
- Thailand
- Bolivia
- Somalia
- Sierra Leone

Factsheet: http://www.who.int/mediacentre/factsheets/who104/en/print.html
The 'TUTU tester' van is a mobile clinic that incorporates TB and HIV check-ups into general health check-ups. The aim of this is to avoid the stigma associated with HIV and TB. Someone visiting the van could be going for a regular health check, and not to check for TB or HIV, and therefore does not feel ashamed to do so.

Thursday 8th January 2015
Health Lesson 20
There are plenty of facts and statistics in the Health topic that can be incredibly useful towards writing our essays. Some of these facts can be listed below, or you can always find your own, through Google, the WHO website or just your textbook.
- Almost 1/10 adults have diabetes
- Tobacco kills nearly 6 million people each year
- Approximately one person dies every six seconds due to tobacco
- 150,000–300,000 children die from inhaling tobacco smoke per year in just the US
- Mental Health disorders are among the leading causes of diability
- 1 in 5 young people suffer from a mental illness
- (That’s 20% of our population but only about 4% of the total health care budget)
- Depression affects 300 million people worldwide
- Daily, 800 women die due to complications in child birth or pregnancy
- 80% of premature deaths could have been prevented
- 3/10 Global deaths are caused by cardiovascular disease
- 6.6 million children under the age of 5 die every year
- Life expectancy has increased globally by 6 years since 1990
- It's now 62 in low income countries and 79 in high income countries
- HIV/Aids
- Lower respiratory infections
- Heart disease
- Diarrhoea
- Cerebrovascular disease
- Childhood disease
- Malaria
- Tuberculosis
- Chronic Obstructive Pulmonary disease
- Measles
- Heart disease
- Stroke
- Chronic Obstructive Pulmonary disease
- Lower respiratory infections
- Lung cancer
- Car accident
- Stomach cancer
- High blood pressure
- Tuberculosis
- Suicide

Some of the Millennium Development Goals can be applied to this topic:

Tuesday 6th January 2015
New Topic: Health! Lesson 19
Before the holidays, we were working on case studies for Rural and Urban areas. Now we have started a new topic, Health.
'Health is a state of complete physical, mental and social well-being, not merely the absence of disease or infirmity.'
- WHO, 1946
Current Health Issues may include...
- HIV/AIDS
- Obesity
- Bird flu
- Climate Change
- Malnutrition
- Coronary Heart Disease
- National Health Service
- Diseases of Affluence
- Mental Health Issues
- Drug Abuse
There are multiple Health indicators:
- Mortality - number of people who die from a certain disease or cause
- Morbidity - number of people ill with or suffering from a disease or disability
- Well-being - how well people feel, linked with quality of life
Factors that can affect Health include:
- Poverty (ie health expenses..)
- Education, especially for girls (workforce, kidnappings)
- Contraception (STDs)
- Environment (access, climate change)
- State and Society (corruption)
- Availability of Healthcare (doctors per person)
- Gender (abuse, see education)

Tuesday 2nd December 2014
Rural & Urban Areas Lesson 18
We have now begun a new topic: Rural and Urban areas! This topic will focus on a variety of factors that affect living in either type of area, as well as suburban areas, and models for the development of urban and rural areas. The main factors we will study are:

Natural population change – difference between birth rate and death rate
There are also many different types of Migration:- Rural to Urban
- Urban to Rural
- Immigration
- Emigration
- Short-term
- Long-term
- Economic
- Forced
Character of an area - the combination of qualities or features that distinguish one area from another
There are plenty of differences between rural and urban areas, that affect the character of the area, and who would wish to live in that area.


Urbanisation – increasing proportion of country’s population living within urban areas (ratio or %)
Urban growth – increase in size and population in an urban area over a period of timeUrbanisation has been increasing across the world as more and more countries begin to build up their industries, leading to the abandoning of agriculture and the movement of people to cities.
Social Welfare – The wellbeing of the community as a whole. Includes ‘government provision of assistance to persons in need’
State pensions are the most expensive government provision, and increase by around 2.9% each year. The budget for education, on the other hand, decreases by about 1% every year.For more information on government spending and to compare government spending on education and child care to pensions and elderly care see the infographic below:

Lesson 16-17: See China Case Study
Thursday 13th November 2014
Population Lesson 15Ageing populations are becoming more and more common across the world for various reasons, be it the result of recent baby booms, longer life expectancy or declining birth rates.

Tuesday 11th November 2014
Population Lesson 14
Poland to UK Migration.
http://vimeo.com/77151640
Thursday 6th November 2014
Population Lesson 13
Another box ticked on the skills list! Maps usually show movement, of people, goods, traffic, water etc. Today we focused on maps which show migration. These include:
Flow Lines

Desire Lines
Trip Lines
Flow lines are where width of the arrow represents a flow rate also which direction the flow is moving often used for rivers discharge. Desire lines shows where a population moves from one area to another, e.g. animals migrating. Trip lines show where populations have visited an area e.g. shopping centre.
When studying migration we have 3 main focuses. These are:
- Scale
- International/ Regional/ Local
- Short/ Long distance
- Time Scale (Temporary/Permanent)
- Rural to Urban
- Developed to Developing & vice versa
- Social/ Economic/ Political/ Environmental
- Forced or Voluntary
- Legal or Illegal Immigration
It's important to be able to separate these out into social, economic, political and environmental. Here are some examples of push and pull factors for areas of countries:

Green is for pull factors, red is for push.
This year, recommended migration case studies are:
- Poland to UK
- Mexico to USA
- Diego Garcia
- Transmigration in Indonesia
Tuesday 4th November 2014
Population Lesson 12
Back from half term, somewhat unfortunately, and back into geography. Since we received our 15-mark essays back today, a quick reminder to be specific and use exemplification.
Today we focused on population and resources, that is, the idea that the more resources a country has, the larger a population it can support to a decent standard of living. Resources is usually taken to mean food supply, fuels, etc., but proceed with caution! In past exams it has been known to mean healthcare, housing and other more societal concerns.
There are 2 main categories of viewpoints of what could happen in the future, due to the exponential population increase we have been experiencing. These are separated into 2 categories:
- Optimistic
- Pessimistic
Thomas Malthas, as we are already aware, argued that population growth grew exponentially and food supply grows only arithmetically, so eventually population will inevitably outstrip food supply, and lead to famine, war and disease (unsurprisingly, the pessimists are pretty much all doom and gloom.) This would eventually lead to the 'Malthusian catastrophe' (and doesn't everyone want their own personal apocalypse named after them?), otherwise know as the Malthusian check, when people would begin to starve, and development was forced to return to subsistence-level conditions, with each person making enough for them to survive on personally, as a sort of 'each man for themselves' natural prediction.
Malthus believed the only way to stop this, was through slowing population growth. However, he lived in a time of 'Laissez-faire' government, when the government would refuse to become involved with public issues. Therefore, as humans do not tend to limit their population size voluntarily, preventative checks which occur naturally were need. He segregated these into positive and negative checks.
Negative Checks
- Included abstinence and the postponement of marriage
- Malthus could not take into account introduction of Birth Control
- Not that Malthus only proposed this for the lower classes
- Thomas Malthus was also an 18th century Christian minister most of his life.
- Famine, disease and war are surprisingly considered positive checks
- These increased the mortality rate across the earth, curbing population size
- Didn't predict human interference, i.e. cures for diseases
- The Industrial revolution
- GM crops, other agricultural advances
- Leaps made in technology
- Transport and refrigeration
- Medical advances
- Global spread of technology
The Club of Rome is a global think tank that deals with a variety of international issues. It was founded in 1968 in Rome and still exists today, although it has moved to Switzerland. It consists of current and former heads of state, UN bureaucrats, politicians, scientists, diplomats, economists and business leaders from across the globe. What we are interested in is its 1972 report 'The Limits to Growth', which brought it significant attention.
5 variables are examined in the model. These variables are:
- World population
- Industrialisation
- Pollution
- Food production
- Resource depletion

The above model shows their most popular 'collapse' scenario.
However, there are limits to this model as well. They did not take into account human dimension, adaptability, innovation and perseverance. They also did not take into account how human responses have changed. For example, alternative sources to fossil fuels, such as wind turbines, solar panels and nuclear power stations. We have also used HYV seeds to stop famines in Asia. HYV seeds were developed by scientists to improve food supply or reduce famine and can produce up to 6 times more crops than regular seeds in the same area of land. The crops they produce are also more wind and rain resistant, and increase a farmer's profits. (HYV stands for High Yielding Variety). Furthermore, the Club of Rome admit themselves the estimate is more of a guesstimate, referring to it as 'a prediction, only in the most limited sense of the word.'
This is the Club of Rome's website: http://www.clubofrome.org/ (just in case you were interested. Im not trying to recruit/convert you in any way. Honest.)
Finally, we have an (yes, singular) optimist.
Ester Boserup was a Danish agricultural economist who believed that people had to resources of knowledge and technology to increase food supply. In 1965 Boserup wrote
necessity is the mother of invention.By this she meant that is human needs grew, we would come up with new ways of supplying to that demand. HYV seeds are a very good example of this, as are other GM crops.
She suggested the opposite to Malthus - rather than outstripping food supply, population growth encouraged food production to increase as well and allows development to occur. She believed that demographic pressure (population density) promotes innovation and higher productivity in use of land (irrigation, weeding, crop intensification, better seeds) and labour (tools, techniques). She argues that changes in technology allow for improved crops strains and increased yields.
However, Boserup assumes that people knew of techniques required by more intensive systems and used them when the population grew (her theory relies on human knowledge and understanding). Boserup admitted that overpopulation can lead to unsuitable and unsustainable farming practices which can have permanent negative consequences on the land. Population pressure is one of the reasons for desertification in the Sahal region, so overpopulation puts fragile environments at risk. Boserup's theory, like most population theory, also fails to take into account the effects of migration.
Tuesday 21st October 2014
Population Lesson 11
The First modern census was in 1801, and there have been 1 every 10 years ever since. It typically includes around 40 questions. These can be about accommodation, education, workplace, migration, language, health, age, sex or other topics. The total cost for the government is, however, quite high. Until recently the data was stored physically and was incredibly expensive, taking up a lot of archive space and requiring a lot of care. Every year 70,000 people are involved in carrying out the census (they are known as enumerators) and it takes 5 years to process the data, and complete the reports. The process is long and costly, but important to help governments, companies and local councils plan for the future, as well as monitor current situations. For example, if a large number of babies are born in 1 area, then we know that new schools should be built in that area soon.
People who may not take the census include:
- Students who live away from home
- People on Holiday
- The homeless
- Those working abroad
- Soldiers and those working in embassies
- Illegal immigrants
- Those in prison or on ships
- Gypsies
- Those who cannot speak English
They may not fill out the forms because they don't have an address, or because they cannot write/read English in order to answer the questions.
On average 98% of the population take the census, despite no one being exempt from it. This changes nationally however, as in Kensington and Chelsea the number of forms filled was only 64%.
In the 2011 census, the largest age demographic was 30-44, and the mean age now almost 40. There are now also over 3 million people over the age of 75.
Thursday 16th October 2014
Population Lesson 10
Like all models, the DTM has its limitations. It failed to consider many possibilities or future events, and has had to be modified to fit changing populations.
- Birth Rates in several countries (Sweden, Germany) have fallen, causing the idea that perhaps a 5th stage should be added to the model.
- The model is Eurocentric, as it was formed on a study of western history.
- It has become doubtful that countries in sub-Saharan Africa, specifically less developed ones, will ever become industrialised and therefore cannot progress through the stages suggested in the DTM.
- The model assumes that the fall in Death rate in stage 2 was due to industrialisation, when in reality it only began to fall after advances in medicine.
- In some countries, the progress through stages are far more or less rapid than the DTM would suggest, such as in Brazil when the fall in BR in Stage 3 was slow, due to religious and political opposition to Birth control techniques.
- Many countries develop at an incredibly fast rate, squashing the timescale of the model as these countries progress (Hong Kong, Malaysia)
- The model does not take into account key factors such as the role of government in population control, and the impact of migration on population.
- Some countries in Southern Africa appear to have moved backwards from Stage 2 to Stage 1 due to unpredicted factors such as the spread of HIV/Aids.
Tuesday 14th October 2014
Population Lesson 9

Each stage of the DTM has a name, which were given to us this lesson. Stage 1 is high-fluctuating, Stage 2 is early expanding, Stage 3 is late expanding, Stage 4 is low-fluctuating and Stage 5 is declining. Other labels we can give the 5 stages are Pre-modern, Urbanising, Mature Industrial, and Post-industrial, respectively.
The DTM is based on Malthusian theory from the 18th century, which theorises that population growth is pushing us towards famine and war, and was created by Warren Thompson in 1929. He believed economic development relied on population control and argued that population, food and the economy were intrinsically linked. The DTM was based on his study of western, industrialised countries only.
Tuesday 7th October 2014
Population - Lesson 7
The DTM - Demographic Transition Model - is used to predict the progress of a country through 5 stages of population change.
The 1st stage
- Rural, Pre-industrial society
- Regular famine, disease and poor sanitation
- Birth rate stays high to compensate
- Population growth is slow and steady
- Examples include the Amazonian Tribes
The 2nd stage
- Economic development and increased wealth
- Improved food supply, sanitation, medicine and cures
- Death rate falls but Birth rate remains high
- Population increase is quite rapid
- Examples include The Congo, Chad, Sudan, Afghanistan
The 3rd stage
- Birth rate falls in response to decreased death rate
- Healthcare improves, as does access to family planning
- Children more likely to survive, infant mortality decreases
- Laws against child labour make children less of an economic asset
- Examples include 1870-1950 UK, India, China
The 4th stage
- Birth rates and Death rates are both now low, and growth stabilises
- Some theorists speculate that this is the last stage of the DTM
- Women have an increased status and fertility rates remain steady/low.
- Improved access to education means children are now expensive
- Examples include the USA, France, Modern UK, Spain
The 5th stage
- Birth rates decrease a little, causing natural population decrease
- Identified commonly with aging populations
- High dependency ratio due to large numbers of elderly citizens
- Countries often encourage migration of young workers into the country
- Examples include Germany and Japan
Thursday 2nd October 2014
Population - Lesson 6
We were given more population information, and a myriad of exercises to practice our geographical skills and knowledge. Try some out:


Population - Lesson 5
Here is some supplementary information about population change. There are some notes on the pages giving you ideas of how you can use the information for revision:


Thursday 25th September 2014
Population - Lesson 4
To begin the lesson we made 'Mortality Diamonds'. As well as sounding like the secret weapons of choice for dark wizards everywhere, these helped us put our factors into perspective by how important we thought they were.
This is what we thought:
- Factors for the Death Rate
(LEDC)


(LEDC)


I have left a blank one for you to include your own opinion. Which factors do you think are most influential?
The rest of the lesson was spent assessing and calculating Vital Rates. Of the World's land area, only 11% presents no serious limitations to settlement and agriculture. Much of the remainder is inhospitable. This is just one factor we must consider when looking at population distribution. It's easy to generalise and over-simplify in a world view. When looking at local views, or change over time, remember to give more complex causes for patterns, taking into account economic, social and political factors.
And finally, remember that population density is not actually a population indicator.
Tuesday 23rd September 2014
Population - Lesson 3
Vital Rates are a set of statistics that are needed to calculate population change. These population indicators are different depending on a country's stage of development, they are birth Rate, death rate, migration, infant mortality, fertility rate, longevity, life expectancy, population structure, GDP and population density. We need to know not just the meaning of the terms, but also the factors that affect them and how to calculate them. During the exam it is also impressive if you can quote figures and explain how they vary with development (this is mostly what we did at GCSE).
They are split into 2 categories:
· Crude Rates (The overall change in births and deaths)
· Refined Rates (Change in a specific demographic ie age, gender, race)
The total population of a country is effected by the birth rate, the death rate, immigration and emigration, (remember 'i'mmigration is 'in' to a country and 'e'mmigration is to 'e'xit out of a country). If asked to distinguish between natural population change and migration change (these for indicators), you should answer something similar to this:
Use the definitions in your answer and be sure to explain your points.
We finished with an activity separating factors and deciding whether they would be more likely to affect birth rate or death rate. Although some of the factors may have appeared to be obvious, all factors could go in both sides of the table.

When arguing points there is not always a right or wrong answer as long as you can back up your points with a reasonable argument.
Here is some useful information on vital rates:
When arguing points there is not always a right or wrong answer as long as you can back up your points with a reasonable argument.
Here is some useful information on vital rates:


Skills - Lesson 1
(This lesson was more human geography based rather than skill based so we decided to insert it on this page.)
Thankfully, a very easy lesson for the last period of the week - based on mapping out our own personal geographies. We first filled in a questionnaire of where we where born, where are favourite place in England is, what countries we have visited in the world (for this is essential for a geographer), our favourite places and where we would like to travel to in the future (followed by a lengthy but interesting discussion of Mr N's trek in Peru, ending with his visit to the Machu Picchu). The stunning scenery of Toronto, the film-like atmosphere of New York, and the adventurous journey to Kenya all sparked conversation within our class: sadly, Olivia and I were trumped by a very impressive 23 visited countries, from one of our fellow classmates.
Next, we each drew a rough map of the places we go often in the world, for example: home, school, high streets, friend's houses, activity classes, holiday homes etc. and connected them. This is actually a technique the police use to find criminal. Normally, crimes are committed between a criminal's home and workplace - mapping out their personal geographies is actually a very accurate way of calculating their daily schedule. Following this, we created diagrams of our national and international acquaintances, working out how they connected - creating a hardcopy Facebook friends list.
Suddenly, this got us thinking about the 'six degrees of separation' theory: "I am bound, you are bound, to everyone on the planet by a trail of six people". This has been tested by trying to send a letter from one stranger to another stranger by passing the letter through a chain of people and measuring how many steps it took. This is truly riveting because we may only be six steps away from our favourite celebrities or idols. Click here to look at the article we studied in class.
Personal geographies are not actually so personal at all, we are all connected in one way or another and these geographies are normally the reason for this. The older you become the wider you network - the more places you have been and the more people you have met - I wonder if you could connect one person to all the people in the world (maybe not through six steps but could this be possible?) I hope you have been inspired by this and perhaps you could research it by travelling through a chain of your Facebook friends and see who you end up with, comment your results below.
Thursday 18th September 2014
Population - Lesson 2
Population - Lesson 2
This lesson had a list of questions attached to it: what happened / will happen in the past / future to global population, where has / will this happened and why has / will this happen? We began by looking at the issues facing population change in modern times. EU migration is a popular topic in current politics, and describes the free movement of people from one EU country to another; consequently, causing overpopulation in the source country and an elderly population in the host country. Forced migration (due to war / disease), population booms (for example, the baby boom after WWII) and contraception / family planning cover just a few other issues that we looked at briefly - all of which you should have studied at GCSE.
At the beginning of the lesson, the population was around 7,225,623,578 people, this number rose by a staggering 352.5 thousand once the lesson had finished. We also learnt from the same website that every 0.41 secs a person is born, creating 75 million new lives every year!

Miss S decided that the 1st key skill we had to learn was graph reading. We first described the graph above: this involves writing what you can see and interpreting it, i.e. 'From 8000 BC to around 1000 AD, the population slowly and steadily increased, remaining low, at less than 1 million. After 1000 AD there was a sudden rapid increase in population and by 2000 AD it had exceeded 6 billion. This continuous growth is untrue in the case of a sudden dip in population just after 1000 AD.' This briefly described the general pattern and any anomalies.
Next, we explained the graph, this is when you have to say WHY the graph is like this. Extra knowledge of the plague, industrial revolution, the DTM, as well as discoveries in the world of medicine, food production and food preservation, are needed to answer why the population has changed like this (if you would like an example response to the question ‘Explain the graph,’ please comment below).
Lastly, we created a mind map about the causes of population growth, writing ideas that would be useful to draw upon in the exam. It is very beneficial to create mind-maps because it targets the creative side of our brains and makes it easier to visualise information in pressured conditions.

Tuesday 16th September 2014
Population - Lesson 1
The first human geography lesson kick-started today. The first half of the lesson consisted of tips for handling the Geography A level and the contents of the course. As a quick reminder, our teacher would also like us to use abbreviations in note taking. The Miss S English dictionary is available below:

The lesson involved a 'Speed Learning' activity - Geography's version of speed dating, though a lot less embarrassing and with a few less strangers - in which we read 4 pages of the text book (160-163) and created 3 questions from them; one of easy difficulty, one medium, and one hard. The first page of the textbook was about the rising population of 7 billion, and exponential growth - the idea that the bigger the population, the faster it grows.
The Malthusian growth model was also on this page. The model was created by Thomas Malthus. In 1798, Malthus wrote an influential essay on the subject which stated that because populations grew exponentially, but food production grew arithmetically, eventually the population will outgrow the food sources and many people will starve. The sudden drop in population from starvation was called a 'natural check', like war or disease, as the population would then fall to a manageable level and the process would begin again.
Further statistics show that every year the population grows by an average of 57 million - that's roughly the size of Italy. The UN has 3 scenarios involving this growth - scenario 1 describes a further rapid increase in population size, scenario 2 shows a gradual deceleration, whereas scenario 3 assumes that drastic action will reduce population growth.
The next page describes the DTM, which you should remember from GCSE Geography, which includes the stages countries grow through as they change. Group C countries, usually LEDCs, have high death rates, high birth rates and low life expectancy. Group B countries have high birth rates but lower death rates, and are often NICs. Group A countries have low birth and death rates, and are MEDCs. They are the world's wealthiest countries. This model will be expanded on later in the course.
The final page helped us to understand vital rates, and gave a number of calculations. In fact, my medium level question was based on this page, and asked someone to explain how to calculate the 'Doubling rate'. The answer is, to divide 70 by the percentage change.
Obviously some people had very different ideas of easy, medium and hard. I found people who balked at my questions, and spoke to people whose 'easy' questions stumped me immediately. For the difficulty of question you receives a certain amount of points (1 for easy to 3 for hard), the person with the most points wins – easy right? Ponder on the fact that the person who won earned 18 points when we only played 5 rounds...
No comments:
Post a Comment